Take Your Learning to the Next Level! See More Content Like This On The New Version Of Perxeive.
Get Early Access And Exclusive Updates: Join the Waitlist Now!
Take Your Learning to the Next Level! See More Content Like This On The New Version Of Perxeive.
Get Early Access And Exclusive Updates: Join the Waitlist Now!
I build businesses, both as independent startups and as new initiatives within large global companies. This series of posts is based on an FX Options training course that I delivered whilst contributing to building FX businesses at a number of investment banks. If you are looking to build a business and require leadership then please contact me via the About section of this website.
So far, we have covered the terminology of FX options and looked at the various types of options that form the building blocks of option strategies. In this section we introduce some of the commonly traded standard option strategies. In the previous section, the six building blocks we introduced were:
The underlying position, if any:
And long or short options positions:
Now we look at more detail at some of the individual option positions.
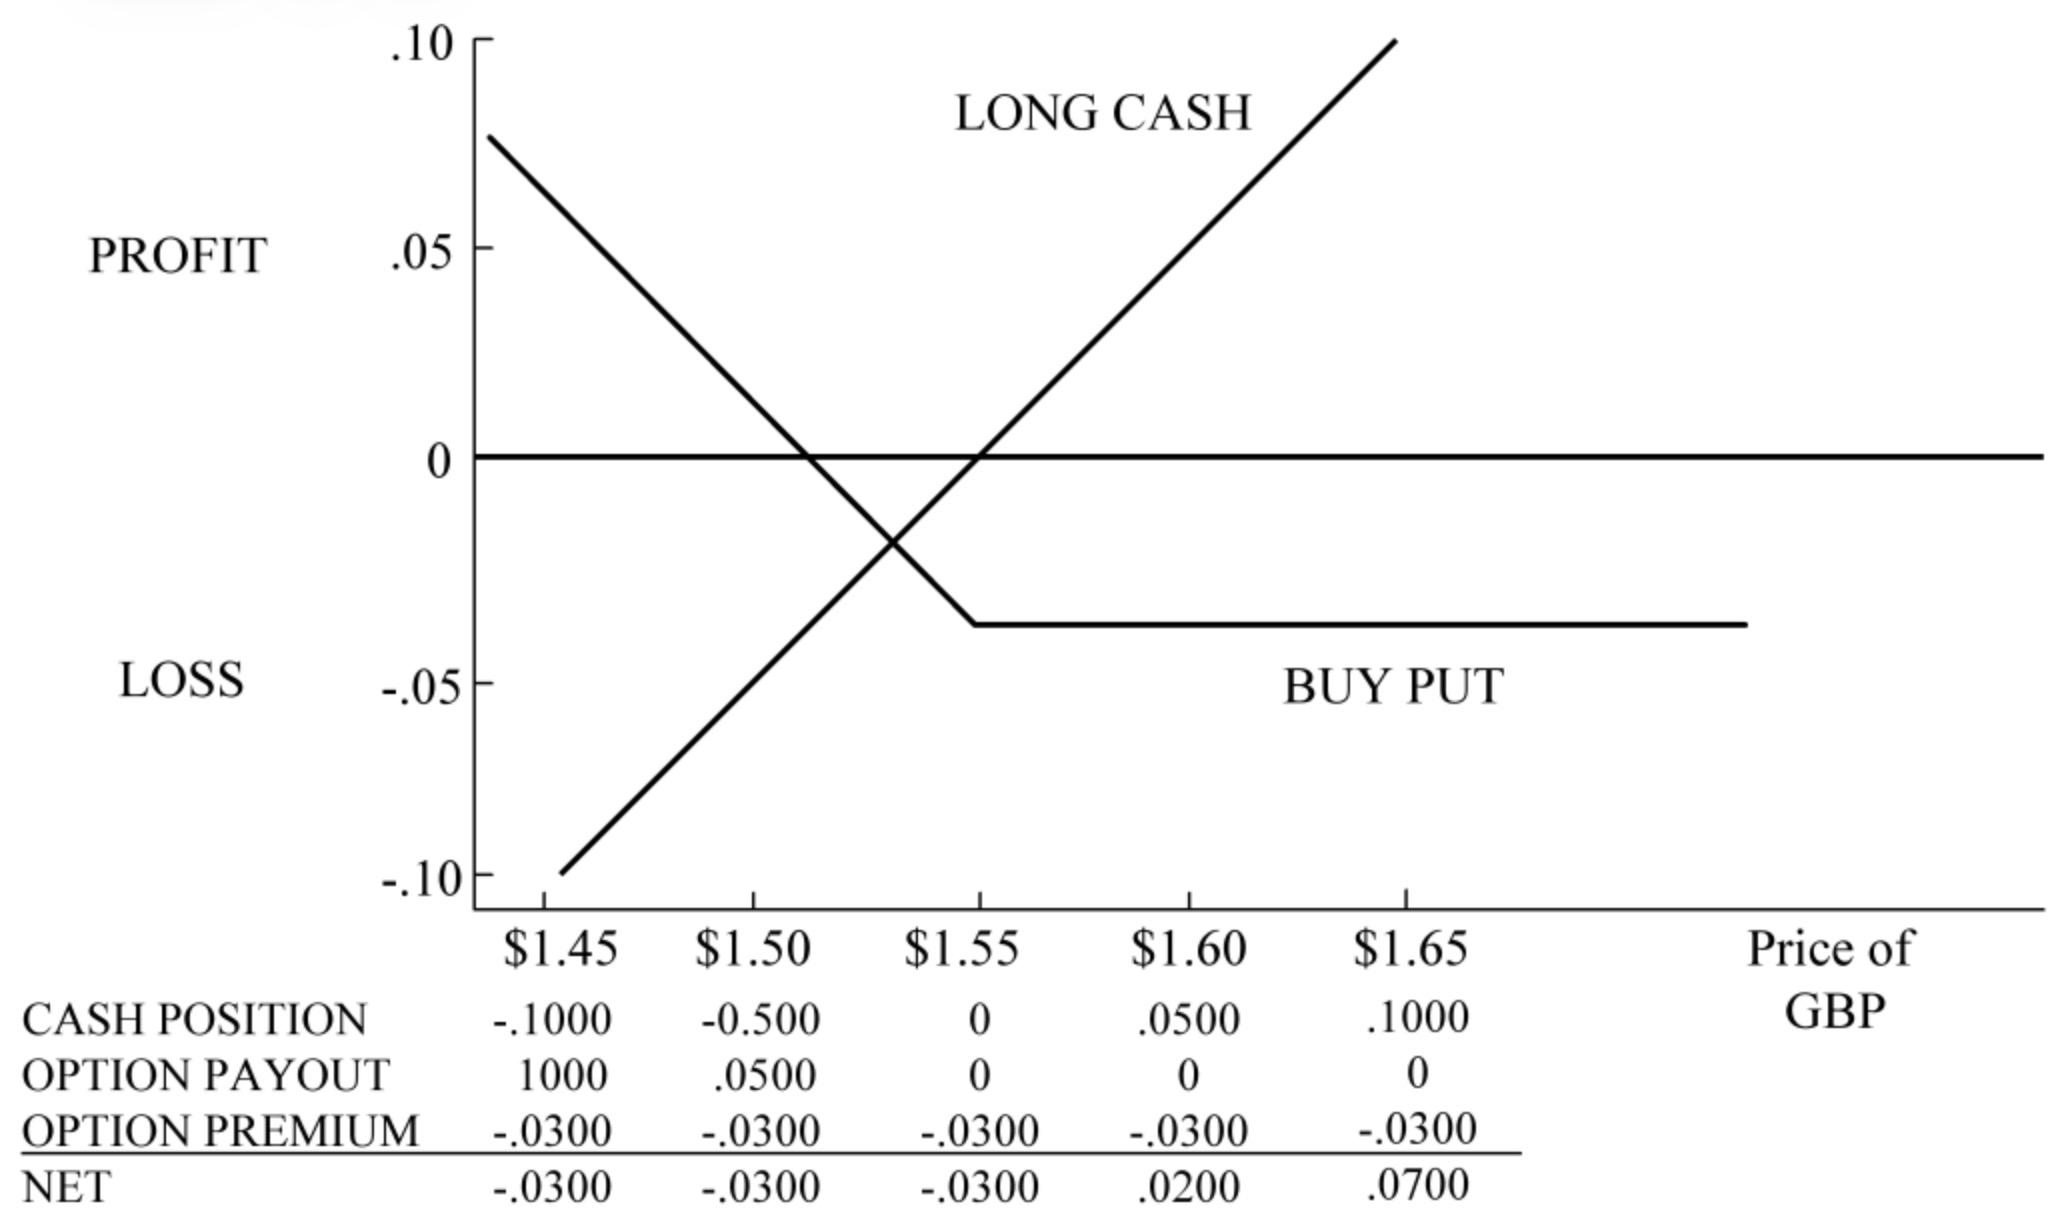
The At-The-Money (“ATM”) option has a strike price equal to the forward rate. The diagram shows the strike price and the forward at the same price on the x-axis, which represents the price of GBP/USD in USD’s.
The table shows the value of the long underlying cash position (or exposure). At the forward rate the value of the forward and the payout from the option are both zero. The only cashflow that has any impact on the net position is the initial premium that was paid to buy the option.
Note that as the price of GBP declines below the forward level the increase in the value of the option exactly offsets the loss on the underlying long cash position. As the value of GBP increases above the forward level the value of the forward appreciates whilst the ATM put option has no value as spot is below the strike price and the option is Out-Of-The Money (“OTM”).
The net position of the combined long cash and long put option is a synthetic long call position.

The breakeven of the strategy is the point at which the cost of the strategy has been covered i.e. the market has moved in favour of the option such that its value has increased by the same amount as its initial value. In the above example the cost of the option was 0.0300 USD per 1 GBP.
The breakeven is therefore:
1.5500 + 0.0300 = 1.5800
This corresponds to the point where the synthetic long call profit and loss profile crosses the x-axis.
Note that the horizontal line of the synthetic long call is the same distance from the x-axis as the long put option. So the breakeven of the strategy is 0.0300 USD per 1 GBP points away from the strike price of the synthetic long call (to the right of the strike price on the diagram).
If the long put option is taken in isolation, the breakeven is 0.0300 USD per 1 GBP from the strike price (to the left of the strike price on the diagram).
The diagram below shows the same situation as for the ATM option of the previous example with the strike price of the put option shifted to a lower price to make it an Out-of-The-Money (“OTM”) option. The synthetic long call is an In-The-Money (“ITM”) synthetic option position.
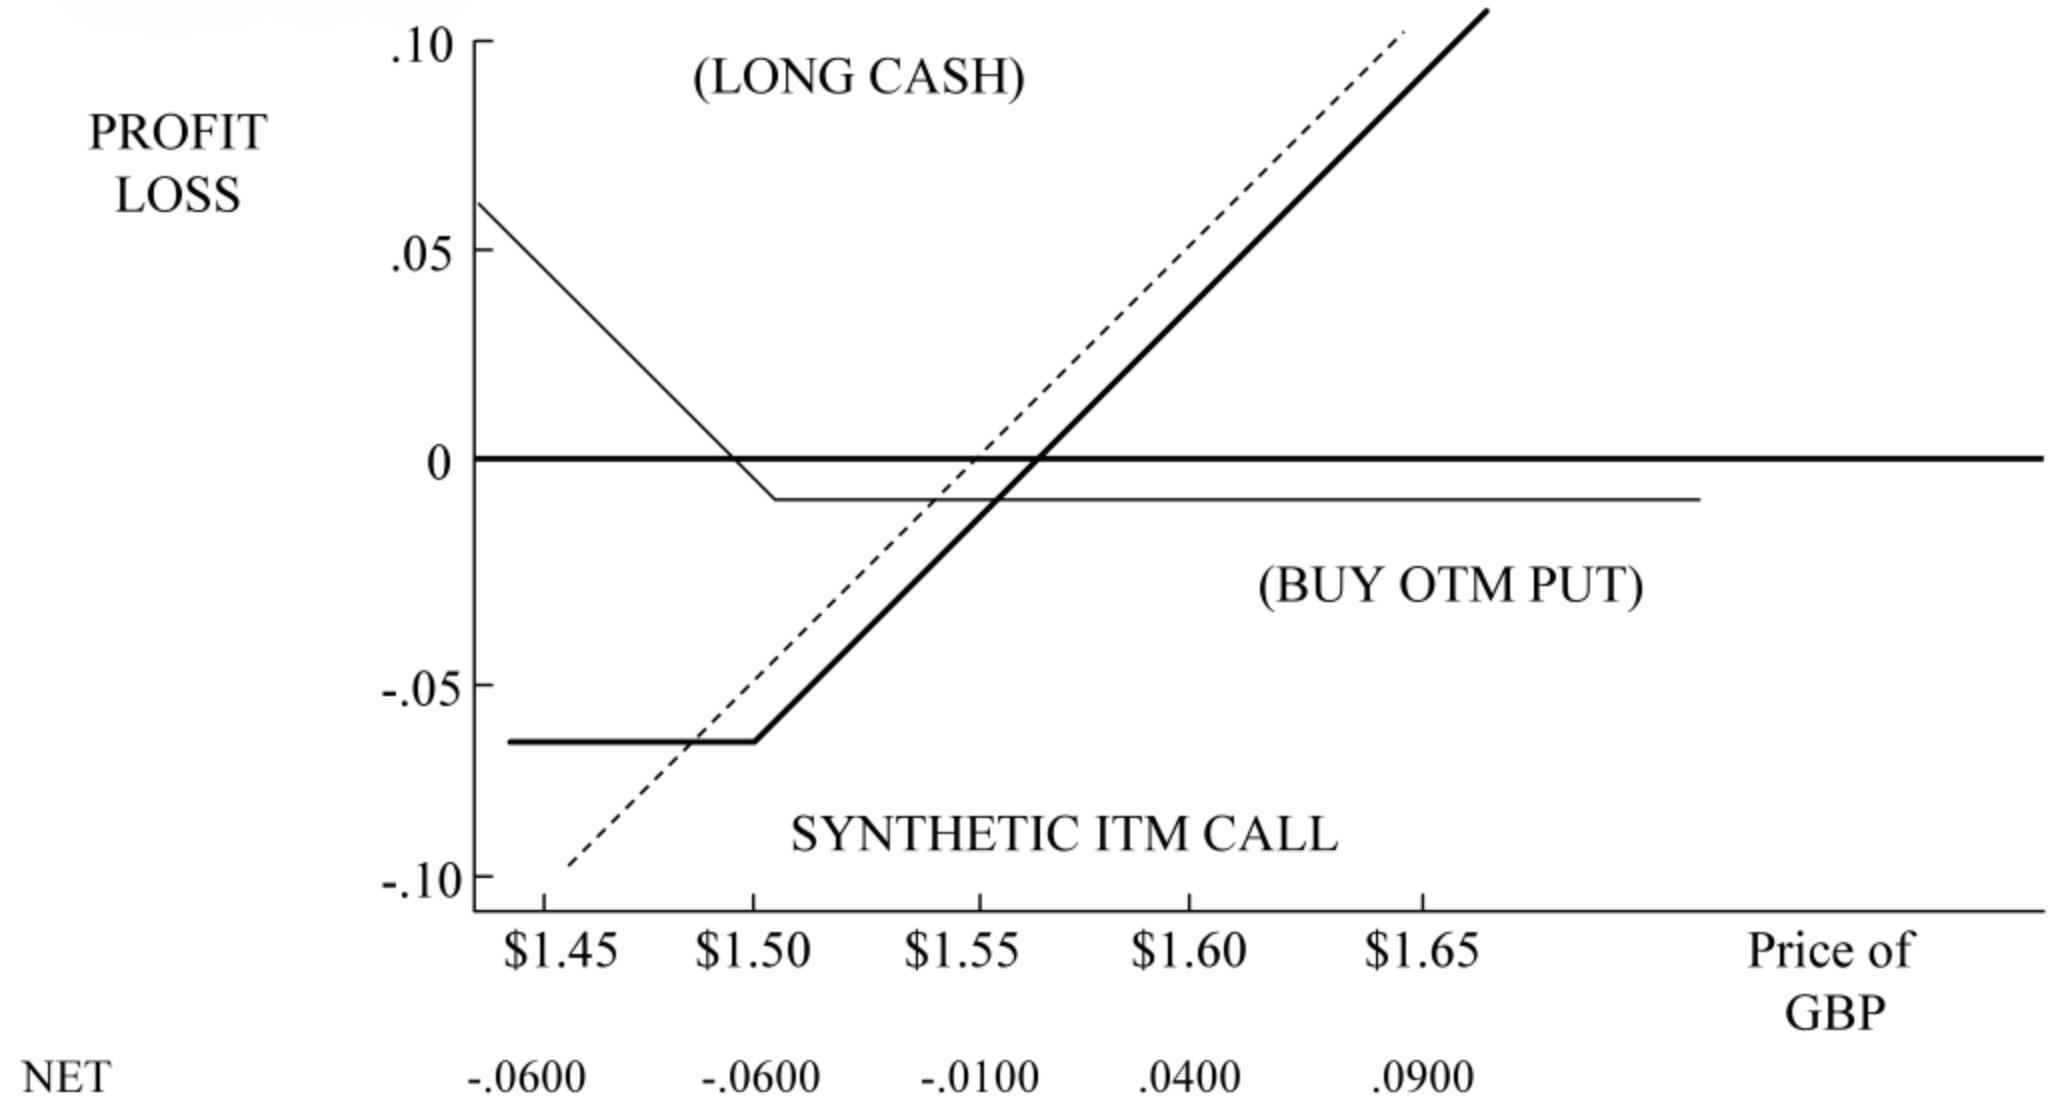
Note that the distance between the x-axis and the horizontal line of the put option is much less than in the ATM example. This represents the premium of the OTM option being less than the premium of the ATM option. In this case the premium of the OTM 1.5000 strike option is 0.0100 USD per 1 GBP, compared to the ATM 1.5500 strike option which had a premium of 0.0300 USD per 1 GBP.
The breakeven of the synthetic long call occurs at 1.5600, some 0.0600 USD per 1 GBP from the strike price. This 0.0600 USD per 1 GBP represents 0.0100 USD per 1 GBP of premium plus the loss on the forward between the forward rate, 1.5500 and the strike price of the OTM put option, 1.5000.
The breakeven of the OTM put option if taken in isolation is 0.0100 USD per 1 GBP points from the strike price, that is the same distance from the strike price as represented by the premium of the option on the y-axis.

Extending the example one step further, we can now examine the purchase of an ITM option.
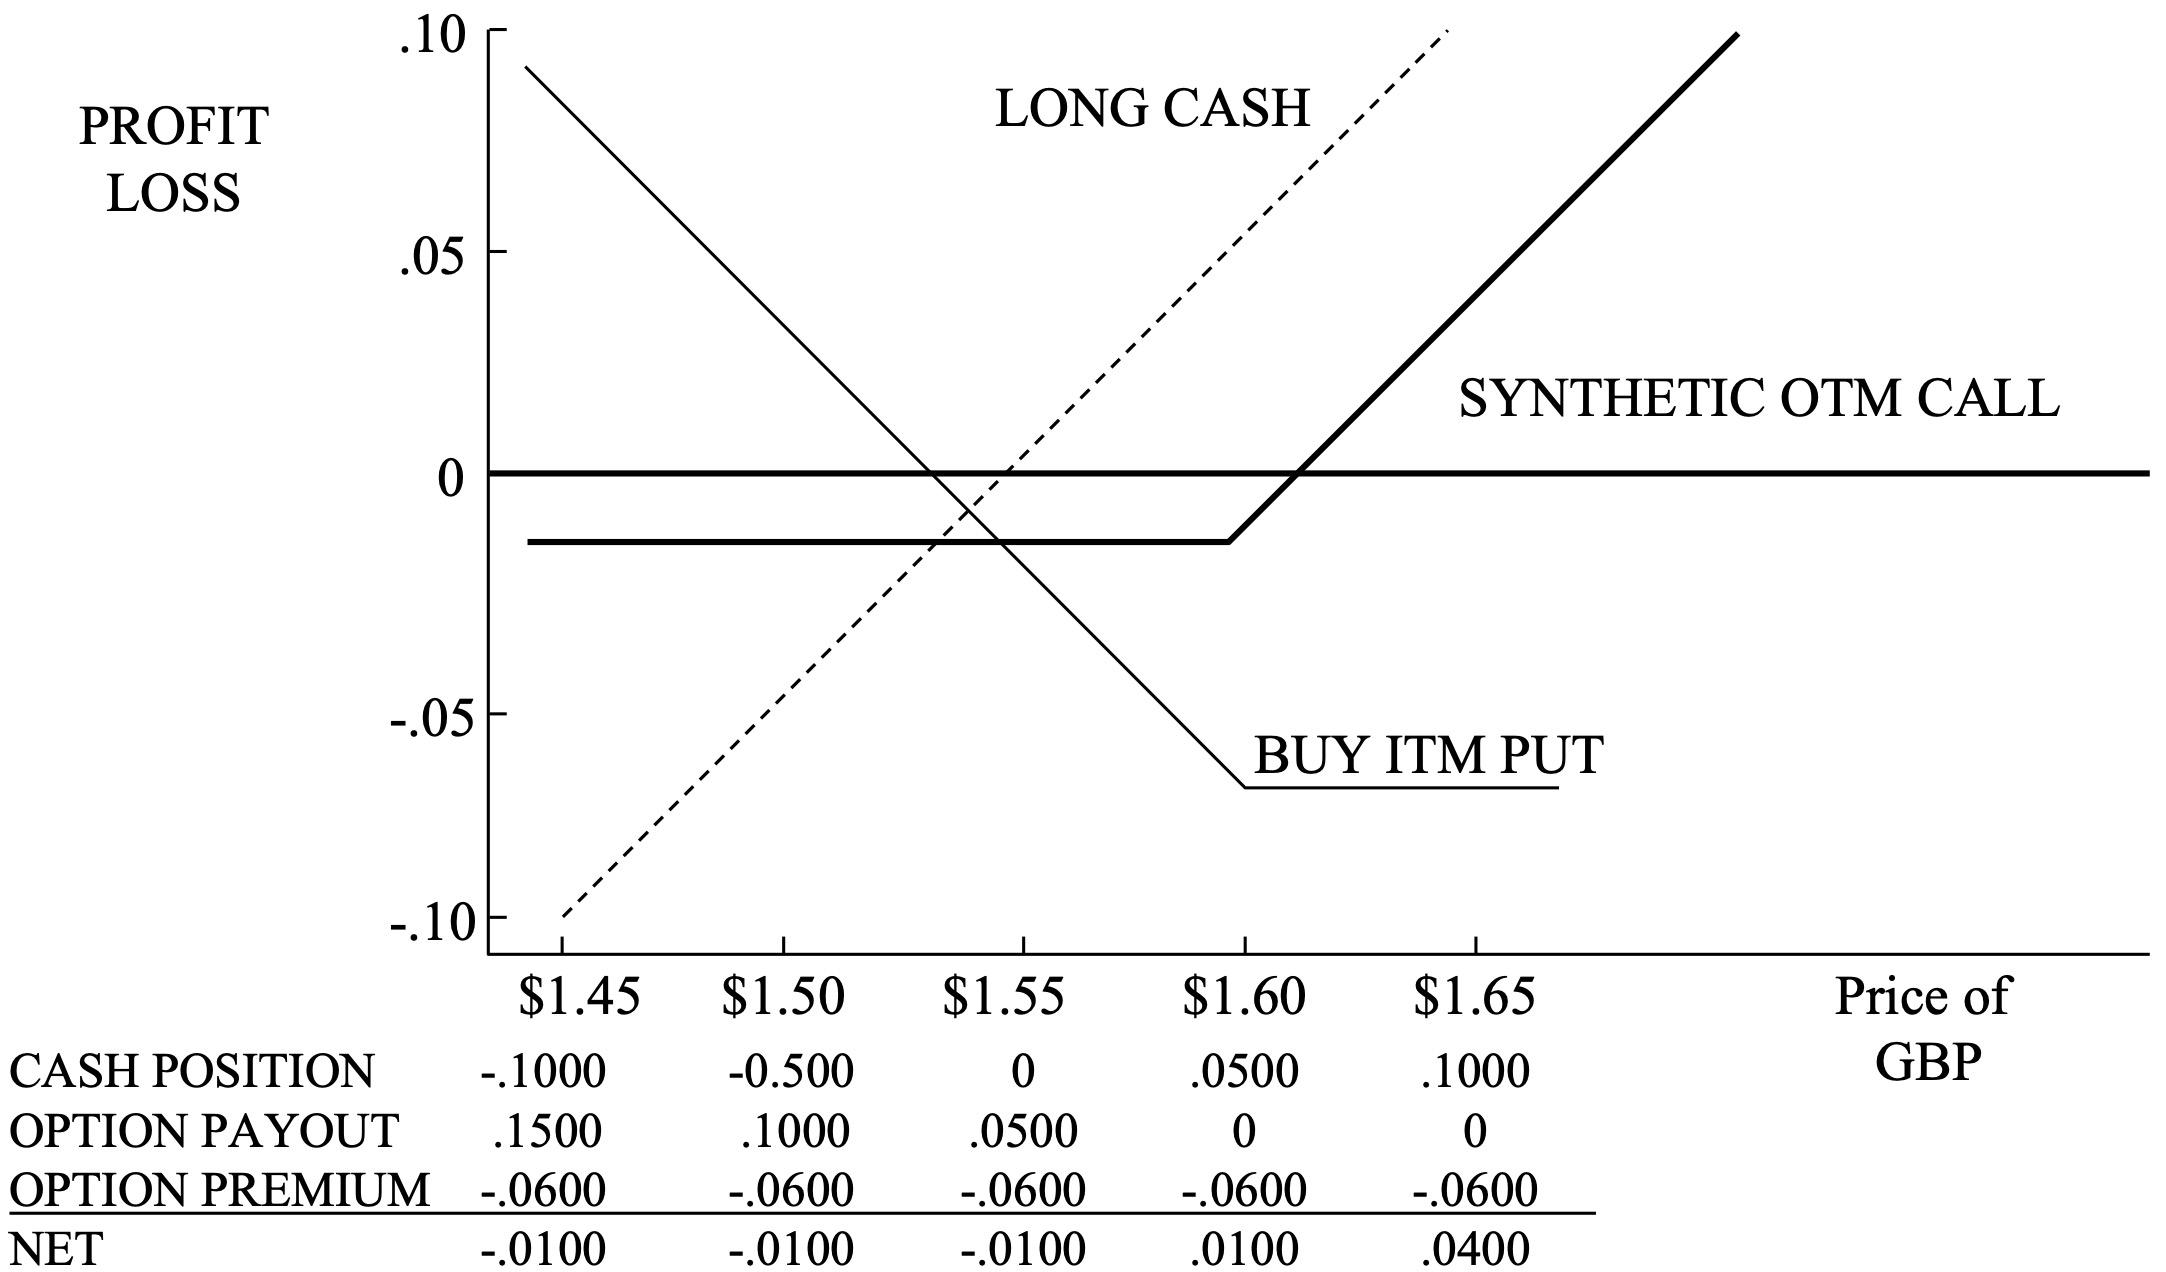
The ITM 1.6000 strike put option costs 0.0600 USD per 1 GBP. The breakeven of the ITM put option if taken in isolation is 0.0600 USD per 1 GBP away from the strike price at 1.5400.
Note that the synthetic long call option is an OTM synthetic position. The breakeven of the synthetic long call is 0.0100 USD per 1 GBP away from the strike price. This is made up of 0.0600 USD per 1 GBP paid in premium for the ITM put option offset by 0.0500 USD per 1 GBP in profit on the long underlying cash position.
In the next section we continue our introduction to FX options by looking at option combinations.